

Excluding the former CIS nations (mainly Russia), European car production was just over 18 million in 2015, up 9%. Europe's improved market was the reason and all groups were up except Honda. The list below is for European production so plants anywhere else are not included.
VW Group: All were up and the best of the volume makers was Škoda.
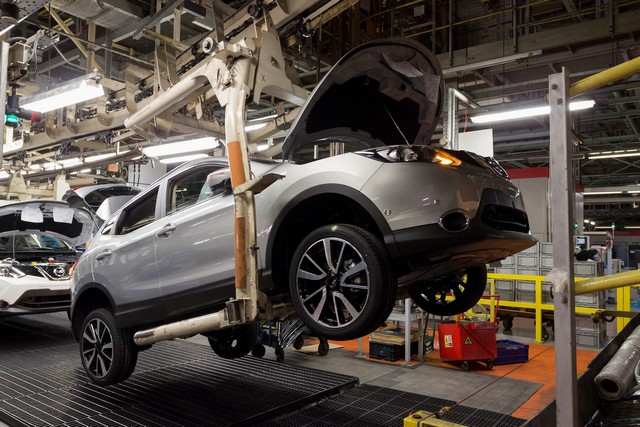
Renault/Nissan Alliance: Nissan has had a good run in the region but stopped in 2015. It was Renault's turn to push things forward.
PSA Group: Citroën was down but flat if DS is included. Peugeot went well and helped the group to a 7.5% increase.
Daimler: Mercedes Benz was marginally up but the other two did well to create a 6.7% rise in volume.
BMW Group: Both BMW and MINI did OK for a 6.3% rise.
Ford: This brand is all on its own now but that didn't matter with production up 10.1%.
FCA: Otherwise known as the Fiat Group, it had a 31.7% increase, with Jeep leading the way.
GM Europe: Trying to become profitable is the goal for GM and it's getting there. Manufactured units were only up 6.1% but getting back into the black is the goal.
Of the others, Hyundai/Kia did nicely with a 12.4% lift in production, with both contributing equally. Then came the Tata Group. After years of strong increases, Land Rover went up 3.5%, with China production affecting Euro volume. Sleeping giant Jaguar stirred with a 36.4% jump. Combined they were up 9%. Finally at the bottom, Volvo and Honda were quiet.
Summary: Not a region that has much growth potential, relying on improved conditions in the region for much of its manufacturing volume increase.
| EU Prod | 2015 | +/- | 2014 | +/- | |
| VW Group | 5,258,609 | 8.4% | 4,853,316 | 6.6% | |
| VW | 2,461,479 | 6.4% | 2,313,909 | 4.8% | |
| Audi | 1,337,487 | 6.5% | 1,256,107 | 8.2% | |
| Škoda | 788,601 | 17.5% | 670,983 | 2.3% | |
| SEAT | 422,327 | 6.8% | 395,513 | 12.1% | |
| Porsche | 234,195 | 15.5% | 203,097 | 23.1% | |
| Bentley | 11,302 | 2.4% | 11,033 | 5.1% | |
| Lamborghini | 3,218 | 39.9% | 2,650 | 24.9% | |
| Bugatti | 24 | -11.1% | |||
| Renault-Nissan | 2,083,275 | 8.0% | 1,929,117 | 6.0% | |
| Renault | 1,143,251 | 15.0% | 993,710 | 9.5% | |
| Nissan | 599,103 | 0.4% | 596,814 | 3.7% | |
| Dacia | 338,589 | 0.0% | 338,593 | 0.6% | |
| Infiniti | 2,332 | n/a | |||
| PSA Group | 2,047,385 | 7.5% | 1,903,803 | -1.4% | |
| Peugeot | 1,209,314 | 12.1% | 1,078,898 | -0.2% | |
| Citroen | 757,179 | -2.9% | 779,786 | -8.3% | |
| DS | 80,892 | 79.3% | 45,119 | n/a | |
| Daimler Group | 1,615,918 | 6.7% | 1,514,732 | 3.3% | |
| Mercedes | 1,443,605 | 2.7% | 1,405,871 | 2.8% | |
| smart | 170,067 | 58.2% | 107,483 | 9.4% | |
| Fuso | 2,246 | 63.0% | 1,378 | 0.7% | |
| BMW Group | 1,534,741 | 6.3% | 1,443,686 | 1.7% | |
| BMW | 1,176,588 | 5.3% | 1,117,335 | 0.5% | |
| MINI | 354,325 | 10.1% | 321,856 | 6.1% | |
| Rolls Royce | 3,828 | -14.8% | 4,495 | 37.7% | |
| Ford | 1,254,278 | 10.1% | 1,138,718 | 6.8% | |
| Fiat Group | 1,123,887 | 31.7% | 853,194 | 9.8% | |
| Fiat | 727,062 | 22.1% | 595,577 | 4.5% | |
| Jeep | 149,929 | 511.8% | 24,505 | n/a | |
| Iveco | 87,659 | 58.9% | 55,183 | 64.9% | |
| Alfa Romeo | 60,914 | -8.4% | 66,466 | -11.9% | |
| Lancia | 58,500 | -8.8% | 64,133 | -10.4% | |
| Maserati | 31,440 | -21.3% | 39,936 | 108.1% | |
| Ferrari | 8,383 | 13.4% | 7,394 | 4.3% | |
| GM Europe | 992,625 | 6.1% | 935,784 | 4.2% | |
| Opel/Vauxhall | 991,247 | 5.9% | 935,784 | 4.2% | |
| Buick | 795 | n/a | |||
| Holden | 583 | n/a | |||
| Hyundai Group | 645,322 | 12.4% | 574,151 | 5.8% | |
| Hyundai | 342,608 | 11.3% | 307,900 | 1.2% | |
| Kia | 302,714 | 13.7% | 266,251 | 11.6% | |
| Tata Group | 489,923 | 9.0% | 449,507 | 7.3% | |
| Land Rover | 387,424 | 3.5% | 374,355 | 10.0% | |
| Jaguar | 102,499 | 36.4% | 75,152 | -4.3% | |
| Volvo | 420,033 | 4.8% | 400,714 | -4.5% | |
| Honda | 119,382 | -2.0% | 121,796 | -12.3% | |
| EU Total | 18,297,782 | 9.1% | 16,769,358 | 4.5% |
Data source: PwC Autofacts.


, European car production was just over 18 million in 2015, up 9%. Europe's improved ...&p[url]=https://carsnewsblog2017.blogspot.com/2017/04/european-production-by-brand-201415.html&p[images][0]=https://blogger.googleusercontent.com/img/b/R29vZ2xl/AVvXsEh5Hs9srcFwo6c6urM7LQZBmeyLPg5lErmjI3yBZiXwNV5x54k0mhY8DFs2-xOuAH_K2r2v3mV-AP8Rx0z5Xt73YakMz0X_7YIA_Oj6R9MxWdgeFwRBvbiOE-MV0PLR5FnknxdaBNgcORI/s640/130.jpg)
No comments