 |
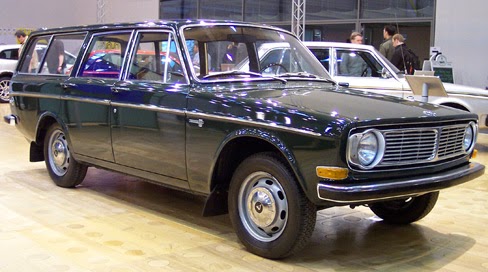
| The Volvo 145 with the company's squared off styling... |
The 1960's saw sales grow strongly in Sweden as it did across Europe. Sales in 1960 were 160,000 and 255,000 by 1969. A 275,000 peak was made in 1965.
Volvo no longer was fighting for top spot as it had a sizable cushion between it and second. VW was strong for the early part of the decade but fell away toward the end of it. Opel was consistent and Ford couldn't keep a top 4 place because of the emergence of Saab. The latter was clearly second by the end of the 60's.
 |
| ...while Saab went for an aerodynamic look with its 96 model |
Sales figures are in thousands, with a decimal place due to not too large unit sales. Next to sales is market share, and the extreme right % figure shows the total market share for the top 4. Thanks to BilSweden for the data.
| Yr | 1st | Sales | % | 2nd | Sales | % | 3rd | Sales | % | 4th | Sales | % | % |
| 1960 | Vol | 40.2 | 25 | VW | 30.8 | 19 | OpV | 26.6 | 17 | Ford | 16.4 | 10 | 71 |
| 1961 | Vol | 45.3 | 25 | VW | 34.9 | 19 | OpV | 26.9 | 15 | Saab | 13.7 | 9 | 71 |
| 1962 | Vol | 49.0 | 25 | VW | 37.0 | 19 | OpV | 27.2 | 14 | Saab | 20.6 | 11 | 70 |
| 1963 | Vol | 53.7 | 23 | VW | 42.7 | 18 | OpV | 35.7 | 15 | Ford | 28.7 | 12 | 70 |
| 1964 | Vol | 58.4 | 23 | VW | 45.9 | 18 | OpV | 42.2 | 16 | Ford | 33.0 | 13 | 70 |
| 1965 | Vol | 59.2 | 22 | VW | 47.3 | 17 | OpV | 47.2 | 17 | Ford | 40.0 | 15 | 70 |
| 1966 | Vol | 51.2 | 25 | VW | 36.3 | 17 | OpV | 31.7 | 15 | Ford | 23.5 | 11 | 69 |
| 1967 | Vol | 45.3 | 26 | OpV | 24.5 | 14 | Saab | 24.3 | 14 | VW | 22.8 | 13 | 66 |
| 1968 | Vol | 55.4 | 26 | Saab | 30.7 | 14 | OpV | 30.1 | 14 | VW | 24.6 | 12 | 66 |
| 1969 | Vol | 59.1 | 26 | Saab | 35.0 | 16 | OpV | 29.2 | 13 | VW | 25.3 | 11 | 66 |


.jpg)


No comments